This is a common question we get asked regarding research project data, and one that needs careful consideration because talking to the right number of people or getting a significant number of people to answer your survey is vital to the statistical reliability of your research.
But how do you know how many respondents are enough? How big does a sample need to be in order to accurately reflect the attitudes / opinions of a population / the group of people who you want to understand?
Firstly, it is vital to establish who your population is: if you were doing an all-inclusive employee survey – this would be the entire workforce. If you wanted to find out how and why people use public parks in a particular city, your population would be the number of residents of that specific city.
Once you have figured out your population size, the next step is to consider how certain you need to be that the answers you collect reflect the views of the population as a whole.
In all of our surveys, we specifically consider statistical reliability of the sample size and use confidence levels and intervals.
‘Confidence interval’ is the plus-or-minus figure usually reported in newspaper or television opinion poll results. For example, if you use a confidence interval of 4 and 47% percent of your sample picks an answer you can be “sure” that if you had asked the question of the entire relevant population between 43% (47% – 4%) and 51% (47% + 4%) would have picked that answer.
The ‘confidence level’ is the likelihood of the sample accurately reflecting your population. A 95% confidence level means that if you were to repeat a sample of the same population you would get the same results 95% of the time – This is the most commonly used confidence level and if used, you can therefore say you are 95% certain (plus or minus the confidence level, as above) that the results are true of your whole population.
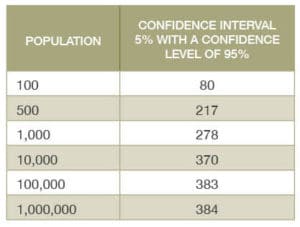
This handy little table shows you a rough guide:

As you can see the calculation is not proportionally linear and there is a point when populations in excess of one million will generate the same sample size. At Mackman Research, we make certain you have the correct sample size for your research project data gathering. If you have a research project you would like to discuss, please get in touch.
Use the confidence interval calculaor below to calclulate your required samle size for your research project.

Dr Gemma Mackman
Research Director
Dr Gemma Mackman is co-founder and Research Director of the Mackman Group. Her professional career has given her a broad knowledge of business practices, an appreciation of good customer service and experience of a diverse range of sectors. Gemma is also a member of the Market Research Society and has completed research training provided by the Economic and Social Research Council.
More About GemmaWhat Our Clients Say

Case Studies
See how our insight makes a measurable difference.
Our latest Blog Posts
From research tips to industry updates.