TELEPHONE 01206 625222
Data visualisation enables researchers to present research findings in a way that decodes or demystifies statistical data via creative visual means. It allows you to translate the message of your data more clearly, and provides the opportunity to display the data in an approachable and readable format, to be shared online or with key stakeholders. It can be a persuasive marketing tool, a powerful source of insight, and a boost to the accessibility of your data.
In this article, we explain the many factors that go into effective data visualisation design, and how to bring added meaning to your data.
The first step to creating valuable data visualisation is to consider your audience. Are the people you will be presenting to accustomed to data? If you are fulfilling a research project for a client, there's a reasonable likelihood that some of the people you will be presenting to may not be used to looking at, and interpreting, data.
In this instance, you should aim to make your data visualisation as simple as possible with easy to decipher visual indicators, and illustrations with a focus on visual impact. You can also emphasise qualitative data in these instances, as they may be more likely to recognise the impact of the results if you include quotes from verbatim responses, or other supporting qualitative data from your research.
While this is almost certainly something you already determined before designing your research, it can come into play again at this stage. Thinking about the questions your research aims to answer can help you to select the correct data and metric to enhance, in order to ensure your data visualisation provides the answers to those questions. This will also come into play when choosing an appropriate chart or visual representation.
This point specifically refers to the additional and crucial information that you have recorded during data collection. Once you have ensured your methods of data visualisation are effectively answering the questions set out in the planning stages of the project, you can then think about whether you could use data visualisation to demonstrate any further insights you have discovered throughout the research project, that weren't necessarily planned for.
Many research projects will reveal unexpected results, which can be highly valuable, so don't be afraid to include those in your findings. You also need to ensure that data visualisation can be used as supporting evidence for any recommendations you make relating to how your client can implement change, create strategies for growth or enhancement, and inwardly react to the research findings.

The most important element of data visualisation is making sure you are representing the correct data in the most effective manner. As discussed above, it is vital to focus on the purpose of the data, and what understanding you (or your client) would like to get out of it, in order to select the best data visualisation method. Below, we discuss a few options for data visualisation and the instances in which you may choose to use each one.
You are almost certainly already aware of most of the types of graphs available for you to use to represent statistical data. Choosing the correct graph for the task, however, can be a little more challenging. You need to consider the number of metrics you wish to display, and any points of comparison or further metrics that would be useful to acknowledge.
For example, many of our surveys involve sorting customers into various groups (geographic, demographic, business relationship, business type, etc.), and in these instances we always display each customer group alongside the average for all customers, to build a clear comparison and allow our clients to see whether any one group's responses stand out from the others. This can be best achieved through the use of clustered bar/column charts, such as the example in Figure 1.

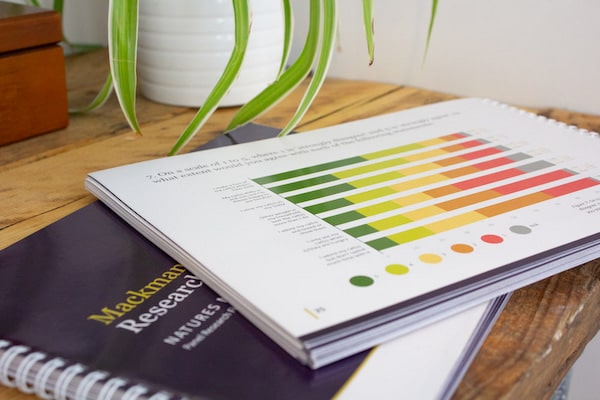
For closed questions where there is a clear scale for responses, such as Net Promoter Score (NPS), or questions with answer options ranging from "excellent" to "very poor", a stacked bar chart can prove invaluable. Stacked charts allow you to create a visualisation of the proportion of respondents who gave each answer, making it easy to identify the areas that need work.

Pie charts can be much more visually appealing than bar, column, or line charts, though their usage is a little more limited. It is recommended that you use no more than six segments in a pie chart to avoid overcrowding, and they can only be used to illustrate proportions of responses on a single metric. If your data does fit this criteria, however, pie charts are very readable and appealing methods of data visualisation.

While there are certainly ways you can visualise qualitative data, such as word clouds or charts illustrating the frequency of usage of certain words, we prefer to write responses out in full. Why? Because it preserves the intention and meaning of a response. We are firm believers in high-quality, meaningful information, so we like to keep responses in their full form to avoid misinterpretation.
If you would like to make lists of long-form responses more approachable, there are a few things you can think about, which are demonstrated in figure 4 below:

While not technically considered 'qualitative' data due to the closed nature of the question, we like to use word clouds to represent questions such as the following: "Which of the following words do you associate with [Company Name]?". This question is followed up with a checklist of words and phrases, out of which respondents can select as many as they feel applicable (see Figure 5 for an example).
Word clouds are excellent in this context as there are a limited number of words that can appear in the cloud, as opposed to the traditional usage of word clouds to pick out repeated words from a block of text or written/spoken responses. We avoid using word clouds for long-form responses as they can pick out irrelevant words, lose the context and meaning of the response, and skew results by displaying synonymous words separately.

Make sure your data visualisation is telling the whole story, and is easy to understand. You may have gathered some excellent insight, but you need to express this clearly and in full, or you run the risk of losing the payoff from your hard work. The people you are presenting to need to know how to use your findings to make progress and improvements.
Here are some tips to help you make sure you are telling the full story:
The illustrative aspect of your data visualisation should link strongly to how you tell the story of your data - be clear, concise, and to-the-point. Keep graphs and charts as simple as possible. Don't include 3D elements, drop shadows, and other effects - just using solid colours and clear labelling will help ensure that your data is easy to understand.
When designing charts, your primary concern should be whether they are readable and get across the message of the data clearly. However, whilst visual appeal should always come second to readability, an attractive chart will capture and hold the interest of your reader.
If you feel that your data restricts visuals, due to the need to display a large amount of data, consider using multiple data visualisation methods to break it down and allow you to involve more interesting design elements. Below you will see an example using Net Promoter Score; Figure 6 displays an example of a potential graph for illustrating NPS, which can be used to display a large amount of information...

...while Figure 7 displays an example of a visual graphic used to emphasise the overall Net Promoter Score.

When designing an overall scheme for a visual findings report, we highly recommend adopting a systematic theme. In practice this requires the creation and maintenance of a consistent colour scheme, typeface, and chart style. This includes using one colour to represent negative data (such as red), and another to represent positive data (such as green). In addition, one colour can represent each of your customer groups across all of your data visualisation. For data (or numbers), it means ensuring you use the same scale across your charts, and maintaining a consistent method of displaying data (percentage of overall respondents, or number of responses, for example).
You should always consider the purpose and usage of your data visualisation when deciding how to lay it out. If it will be used in a findings report for a research project, you may wish to include more detailed charts, such as Figure 2 or Figure 6. If you are intending to display your data in an infographic, such as one to be shared through social media, you may choose to keep your visualisation more simplistic and quickly readable, similarly to Figure 3 or Figure 7. Infographics demand a simpler layout for the purpose of getting across specific points of data, rather than your full findings.
Methods of data visualisation can be vital to translating the messages behind your data more effectively, and making your findings easy to understand for a wider audience. There are a range of styles of visualisation available for you to use, but the tricky part is identifying the best one to effectively convey your data's rich story. However, as long as you take into consideration the data set itself, the people you will be presenting the data too, and the message behind the data, you should be able to find a method of data visualisation that effectively delivers meaningful findings.
If you are considering undertaking a market research project, but aren't sure how to interpret the message behind your data, learn about the research services we offer. Alternatively, you can leave us a message or give us a call at 01206 625222.

Jess Crago
Research and Insight Junior
Jess has a Masters degree in Cybercrime Investigation, and a Bachelors in Sociology and Criminology. She loved the research and statistics aspects of her degrees and now enjoys experiencing the practical applications of research, alongside writing content and experimenting with new software. Her favourite part of research is finding meaningful answers hidden within data.
More About JessWhat Our Clients Say

Case Studies
See how our insight makes a measurable difference.
Our latest Blog Posts
From research tips to industry updates.